Sibos 2013 – The Arts in Dubai

Dubai has two art districts and they are both worth a look. In the Financial District, get to Gate Village, 10 mid-rise towers connected to the Dubai International Financial Center by wooden walkways. It can be pretty quiet on a weekend, but it has fine galleries ranging from large international firms to storefronts.

Check out Opera Gallery, a Paris-based firm with galleries around the world and some very high-end art including Picasso, Miro and Chagall. When I was there in May, Opera was featuring two French artists whom the catalog described as expressionist-surrealist Jean-François Larrieu and illustrator-caricaturist Patrick Boussignac.

Larrieu takes on the towers of global cities in colorful and amusing depictions. I especially like his cityscapes composed of towers plastered in towers in a very flat style  — flat only in the sense that there is no depth, no perspective. The buildings are done in brilliant colors of vertical and horizontal stripes that would give a headache to anyone looking out over such a scene from a balcony, if such a scene existed in real life. In some images of more traditional landscapes, although done in his wildly colorful nontraditional style, vibrant palm trees tower over what are probably beach-front villas, densely packed four-and five-story buildings celebrate with bursts of fireworks in the sky above and in what could be an Italian hill town homes cluster behind curving hills receding into the distance marked by a dark blue mountain. He also does some great butterflies and a tabletop painting that might remind one of Matisse, but Matisse on drugs. In Dubai, where towers are a way of life, I liked those images the best, and was pleased to see that a similar effort was on display in another gallery.

Boussignac paints unrealistic scenes in a graphically realist style. Ok, maybe realist is the wrong word, except that faces look almost photographic in their representation while the figures recall art deco in their style. Fun images.

Across the way in the Art Sawa, another take on urban towers was called Chromatic Landscape by Karine Roche. In a confusion of colors the lines of skyscrapers are still clear, and the paint suggests the active life of a city.

“The city, cities, noise, people behind the colors, flows and networks, accumulation of activities that is giving stun sensations as being in a jungle,” says the show flyer. I like seeing artists taking on cities like this and creating the sense of jumbled activity, as in Larrieu and Roche, or the mystery and suggestions of romance in Bussignac.

A couple of galleries were closed when I visited, and it looked as if one or two featuring art of the region were about to open. Maybe by Sibos…

The other art district in Dubai is in a warehouse area a taxi-ride away from the DIFC in Al Quoz  which proclaims it is the home to almost 40 creative and industrial organizations. Take Exit 43 off Sheikh Zayed Street. Get a map printout from your hotel — a lot of taxi drivers and concierges have never heard of the district. Start at one gallery — I chose Green Art Gallery, and work your way around the block. Some of the galleries are a distance away so you might want to get a group and take a taxi and keep it while you tour. Image

For more: http://www.emirates.com/us/english/destinations_offers/discoverdubai/sightseeingindubai/alquozartgalleries.aspx

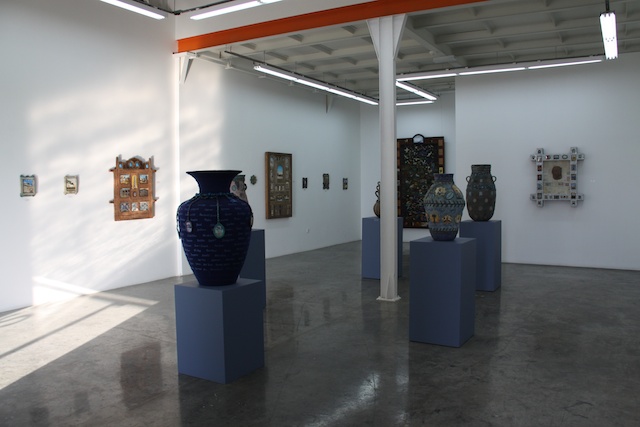
Green describes itself as a contemporary art gallery focusing on artists from the Middle East, North Africa, South Asia, Turkey and beyond. http://www.gagallery.com.


Image

I ran out of time after just four or five galleries and it was getting past 6…fortunately I caught a taxi within a few minutes, but otherwise I could have walked 20 minutes to  nearby shopping center, I was told.

Highlights include GPP Limited (http://gulfphotoplus.com), which shows photography. When I was there is had a group show based on thousands of entries which had been winnowed down to about 100 great images printed on various types of an archival art paper. I especially liked Alisdair Miller’s images of city towers (do you perceive a theme here) including an image where he had moved the camera vertically to streak the light of the skyscrapers.  The gallery has a catalog and limited editions, so you can take home some art without paying a fortune — prices range from 375 AED for an 11×14 to 2,500 AED for one of an edition of five large 24×36-inch prints. It uses the tag line “Art photography for everyone,” and it looks to be the place to go for photography equipment, printing, books, and buying images.

Next door, Carbon 12 was exhibiting Austrian artist Philip Mueller, who at 25 has already developed a large body of work. See http://www.carbon12dubai.com for updates on their exhibits.

Showcase Gallery had some amazing work by a South African artist, Hendrik Stroebel, who uses embroidery to depict scenes, often in the Middle East. The yarn replaces brushstrokes, but with an intensity and tactility all its own as he uses short strokes, an inch or two of the same yarn, to build up a street or wall, much as a painter will use short strokes of a single or distinctive mix of color. He frames the work in ceramic frames that he designs himself. Look him up online if you don’t still find any of his work in the gallery — the images are superb and show up best in the gallery or in the printed catalog the gallery carries.

Posted in Uncategorized | Tagged , , | Comments Off on Sibos 2013 – The Arts in Dubai

Extraterritoriality – It’s What The Other Guy Does

“Here be dragons: Will EMIR’s extraterritoriality rules deter third country firms?”

That’s the title in RegTechFS which watches the evolving regulation so you don’t have to

http://regtechfs.com/here-be-dragons-will-emirs-extraterritoriality-rules-deter-third-country-firms/

The folks at RegTechFS say that the EU wants to exert control on central clearing and risk mitigation — sometimes over two parties where neither is in the EU. Read the post, which for some reason the linkage in WordPress refuses to recognize, for more detail.


Posted in Uncategorized | Comments Off on Extraterritoriality – It’s What The Other Guy Does

Information Mosaic awarded 2013 SWIFT Certified Application

 Information Mosaic, a post-trade software company, has been granted the 2013 SWIFT Certified Application labels for Securities Settlement and Corporate Actions for. the ninth consecutive year.
 
Under the SWIFT Certified Application program for 2013, Information Mosaic has demonstrated its ability to process the full set of corporate action and securities settlement messages. 
“Information Mosaic has shown their continued commitment to certify its solutions and benefit its customers through the SWIFT Certified Application program. Its proven dedication to support customers in responding to the demands of the global economy, create relevant offerings in new and existing areas, and reduce cost, complexity and risk for the industry,” said Filip Versluys, head of partner marketing for SWIFT.
 “The certifications reflect Information Mosaic’s ongoing commitment to provide the the financial services industry with the most advanced post-trade automation solutions,” said Philip Hogan, Information Mosaic’s chief revenue officer.
 

Posted in Uncategorized | Tagged , , | Comments Off on Information Mosaic awarded 2013 SWIFT Certified Application

iStar Financial Tracks Financials With XLeratorDB

When senior executive at iStar Financial meet for strategic planning, their focus  almost always includes a review of numbers. A leader in commercial real estate investments, it has completed more than $35 billion of commercial real estate investments over the last two decades to become one of the most experienced companies in the U.S. commercial real estate finance markets.

iStar says it provides a Return on Ideas.

“We believe that great ideas, developed by great people, generate great returns.”\

Reporting – transforming data into usable information – is key to increasing our effectiveness, said Philip Burke, iStar’s CIO. One of IT’s consistent goals is to streamline processes while producing clean data that executives can rely on for  decision-making without wondering where it came from, or how accurate it is.

“When you contrast today against the go-go-go days like 2007, back then it was just trying to get out of the way. Now we have created a number of systems to automate our processes. It is tough to be under that pressure and given that opportunity in IT, but it is interesting to be part of the company’s productivity story.”

While Excel can be an essential tool for many internal analytics and projections, iStar realized that for its most sophisticated and critical models it needed something more robust. As firms across multiple industries from manufacturing and retail to financial services have learned, heavy reliance on Excel can lead to ‘multiple versions of the truth’. One common result is business meetings that often start with dueling spreadsheets to decide who has the most useful numbers.

With $6 billion of commercial real estate assets to manage, iStar’s senior management team has better uses of their time than debating figures in multiple spreadsheets. The company invests across its four business lines: real estate finance, net leasing, operating properties and land.

For each project iStar creates an extensive asset summary that is part of its risk rating process.

“We rate our assets’ risk parameters every quarter on a scale of 1 to 5 based  on our assessment of potential risk, ” he explained. “Part of that process involves projecting total returns (IRRs) based on actual results to date and projected performance.”

“Before we acquired XLeratorDB, that component of our analyses was done offline on Excel,” says Burke

The models were distributed throughout the company, and each asset manager in each region had different ways of using the models.

“It was impossible to really confirm that numbers had been updated and reflected the most current projections, because all you would see was the resultant number.

The metrics — projected IRRs, projected multiples and earnings multiples — were for internal purposes, he added. The shortcomings of Excel led to an internal managerial push to improve.

“The process was inconsistent, there was no visibility,” he added. If quarterly projections were not updated in Excel, that would not necessarily be apparent to headquarters which simply took the regional numbers and plugged them into the database.

“We needed to correct this without implementing a quality control process that would eat up time.”

The company looked at two solutions before selecting XLeratorDB.

“It has been very useful in ensuring that our projections are more accurate because now we can dovetail our historical and projected performance and you can see any disconnect quite quickly.”

With XLeratorDB, cash flows are pulled from historical transaction systems and projections into the database and from there they stream into the report seamlessly. The combined cash flows are auditable and available online, and they are consumed by senior managers, the CEO and the executive committee.

“The process is faster, more accurate and we have control of the data from start to finish,” Burke added.

It is also much more efficient, important in a time when companies face pressures on margins.

“Every dollar counts now, and clean and accurate information in the hands of management is incredibly critical,” said Burke. “This management team needs to understand the risk/reward of every opportunity and structure in order to capture the best risk-adjusted returns. Being able to run many scenarios efficiently has increased our computational horsepower. It is all about how to invest that next dollar, what is our real return going forward, is it better to invest in project A or look at other projects with a higher rate of return.”

“Further it’s helped productivity as well. Now all of our reporting groups across the company are working from the same set of numbers in real time, cutting down on countless hours spent reconciling.”

With current reporting running smoothly, the next project using XLeratorDB is to create a historical asset return database, said Burke.

“We have purchased and managed hundreds of loans and assets for which all the asset cash flows and return data are stored separately in a spreadsheet somewhere. Now we are converting all the data into SQL and calculating the metrics.”

The first step is collecting cash flows into a single system for a single version of the truth, he added. Then iStar will provide the ability to slice and dice those historical cash flows and any other attributes such as region, property type, asset manager, and asset type such as senior debt, mezzanine debt or equity.

“It will be unbelievably powerful in understanding our historical performance. And with that, we can make better decisions going forward — why were certain regions better performing than others, which borrowers stood behind the projects and which walked away? Which strategies proved most efficient for selling condominiums?

Internally, he has received positive feedback over XLeratorDB from people in operations. The company has reduced staff but still maintains strong demand for information, so technology has to take on the extra work.

“Information is more critical than ever. Through projects like these we are able to automate a lot of processes and give people back their time so they can do work that provides a higher rate of return.”

Posted in Uncategorized | Tagged , , , | Comments Off on iStar Financial Tracks Financials With XLeratorDB

Citi Brings Mobile Access To Trade Finance Application

t may take time for financial business applications to catch up with consumer ease of use, partly because the business is more complex and the amounts at risk are far larger, but it does occur on a regular basis, especially in mobile.


Citi’s Transaction Services has launched Citi Supplier Finance Mobile which allows suppliers to inquire on the status of payments remotely from a mobile device. Once accessed from a phone or tablet, the user is prompted to enter some basic information about the transaction including region, reference numbers and transaction value.  The user is then able to drill down and receive additional information on the selected transaction, including the status of a payment in real time. 


“Citi continues to evolve our trade solutions to bring the mobile office to our clients and their suppliers,” said John Ahearn, global head of trade at the bank. “With this new capability, we are further extending the accessibility of our Supplier Finance platform, making it easier for both buyers and suppliers to obtain critical information about their transactions.”


Transaction services, never the sexiest part of banking, got some new respect as it provided steady earnings with low risk throughout the financial crisis. While it never generated the big wins — and big bonuses —  of investment banking, the transactions services group wasn’t responsible for driving Citi into the arms of the federal government for repeated rescues and guarantees either. 


New features in the mobile supplier app include real-time status inquiry for supplier finance payment and discount requests, invoice level information, filtering by functionality, by date, transaction type and reference numbers. It is available in nine languages including English, Portuguese, Italian, German, Simplified Chinese, Russian, Spanish, Polish and French


Other mobile features and functionality allow entitled users to receive alerts and create and release batch payments for straight-through processing. It was developed by the Citi Innovation Lab in Dublin in conjunction with the CitiDirect technology team.


Posted in Uncategorized | Comments Off on Citi Brings Mobile Access To Trade Finance Application

Fiscal Cliff — Little More than a Speedbump

Paul L. Kasriel

Econtrarian, LLC

econtrarian@gmail.com

1-920-818-0236


December 21, 2012


Festivus Stocking Stuffers


Since I retired at the end of April, I have been having a lot of problems with you people. So, as Festivus is nearly upon us, it is time for the airing of grievances. Here are I few of mine.


Fiscal and Mayan Armageddon


As this is being written, both economists and other quacks are predicting the end of the world as we know it. The economist quacks are forecasting that another recession will occur in the U.S. in 2013 if the scheduled return to the Clinton-era federal personal income-tax levels and if the scheduled sequestration of federal government expenditures occur on January 1. Some other quacks are predicting the end of times today (or is it tomorrow?) as the Mayan calendar runs out of dates. So far, it is not looking too good for the Mayan calendar quacks. And my bet is that if we ever get to test the fiscal quacks’ hypothesis, we’ll shuffle them off with the Mayan quacksters.


What is the logic for fiscal Armageddon? Let’s talk about tax increase first. I keep hearing that if tax rates and revenues rise, there will be a huge amount of spending power sucked out of the economy. Really? You mean that the Treasury is going to collect all of these taxes and just let its cash balance rise by this amount? I don’t think so. I think the Treasury is going to collect higher taxes from me and either transfer them to you or buy something from you. In other words, an increase in tax revenues is not going to “suck” spending power out of the economy, but rather redistribute that spending power. Now, you may not like the outcome of this redistribution, but don’t confuse a redistribution of a given amount of spending in the economy with a net decline in spending.


What about the cut in federal spending due to the sequestration that Congress voted for? Surely, that will reduce total spending in the economy, right? Probably wrong. If the government spends less, all else the same, it will need to borrow less. If it borrows less, those folks – households, financial institutions, feriners – who were planning to lend to the government will now find themselves with excess funds. What are they going to do with these funds? There are three things they can do with these excess funds and two of them will result in offsetting the government’s decline in spending.


One thing they can do with their excess funds is lend them to some other entity – a household, a business or municipal government. These recipients of funds will then spend them, offsetting the decline in federal government spending.


Another thing these otherwise lenders to the federal government can do with their excess funds is spend the funds themselves. If interest rates are too low and/or the credit risk of other borrowers is too high, they won’t lend; they will spend. This increased spending by the otherwise lenders will offset the decreased spending of the federal government.


A third thing these otherwise lenders can do is simply hold more cash than they had previously planned to do. For the nonbank public, this means an increased demand for bank deposits and currency, also known as a decline in the velocity of money. For banks, an increased demand for cash means an increased demand for excess reserves. If the decrease in federal government borrowing results in a decrease in velocity / an increase in banks’ demand for excess reserves, then, and only then, will there be no offsetting increased spending to match the decline in government spending. 


So, logically, there is not much of a case to expect an increase in taxes and/or a decrease in government spending to have a significant impact on aggregate spending in the economy. But according to the fiscal quacksters, a reduction in the budget deficit brought on by a “tightening” in fiscal policy should be associated with slower nominal GDP growth. Conversely, an increase in the budget deficit resulting from a decrease in taxes and/or an increase in government spending should be associated with faster nominal GDP growth. Thus, the fiscal quacksters would expect there to be a negative correlation between changes in the budget deficit and growth in nominal GDP. 


Let’s go to the tape, i.e., Chart 1. As everyone, except those with a political bias, knows, the federal budget deficit can change because of the pace of economic activity. For example, when the economy crashes into the deepest recession in the post-WWII era, federal government expenditures increase because of income maintenance programs for the unemployed – e.g., unemployment insurance benefits, food stamps, etc. Also when the economy crashes, tax revenues fall. So, when the economy crashes, the federal budget deficit tends to widen because of these automatic stabilizers. Symmetrically, when the economy booms, all else the same, the budget deficit shrinks or, once in a Mayan calendar, maybe even moves into a surplus. If we are going to test for the effect on GDP of changes in the budget unrelated to these automatic stabilizers, we need to cyclically-adjust the budget deficit. The experts on the budget, the Congressional Budget Office (CBO) staff, are kind enough to do this for us. The red bars in Chart 1 are the fiscal year-to-fiscal year percentage point changes in the cyclically-adjusted budget deficits/surpluses as a percent of CBO-estimated potential nominal GDP. Whew! The blue line in Chart 1 is the fiscal year-to-fiscal year percent change in nominal GDP. According to the fiscal quacksters, as the cyclically-adjusted budget deficit gets smaller, i.e., the red bar moves higher toward the zero line or even higher above it, nominal GDP growth should weaken, i.e., the blue line should move down. In other words, there should be a negative relationship or correlation between these two series. But alas, we find another beautiful theory of the economic quacksters spoiled by some ugly facts. The contemporaneous correlation between changes in the cyclically-adjusted budget deficit/surplus and nominal GDP growth is not negative from 1973 through 2011, but positive at a value of 0.3 out of a possible 1.0. The ugly facts, then, suggest that increases in taxes and/or decreases in government spending are associated with faster nominal GDP growth, not the slower growth predicted by the fiscal quacksters.


Chart 1

pastedGraphic.pdf


Now, you might argue that it is not fair to expect a change in fiscal policy this year to have a large impact on GDP growth in the same year. Policy changes might have their maximum effect in later years. This, of course is not what the fiscal quacksters are arguing now. They are predicting a recession in 2013 if the scheduled tax increases and spending cuts commence and persist in 2013. But I did test for lags in the effect of fiscal policy changes. I found that the first negative correlation between changes in fiscal policy and nominal GDP growth occurs after three years and even then the absolute value of the correlation coefficient is small at 0.1. In sum, the historical data simply do not support the view that going over and staying over the fiscal cliff will have a material effect on the pace of economic activity. 


Is Federal Government Spending Out of Control?


That’s what I keep hearing. Does anyone ever look at the data? As shown in Chart 2, growth in federal government spending flared up in the second half of 2008 through early 2010. Why? Does anyone remember the $700 billion authorization for TARP spending back in October 2008? And then there were those automatic stabilizers I talked about earlier. And yes, there was about $500 billion of extra stimulus spending. But since early 2010, growth in total federal government spending – entitlements, defense, interest, waste & fraud – has been quite tame, especially when measured against the median annualized growth in total federal spending of 5.1%. Remember that $1 trillion reduction in spending over a 10-year period authorized by Congress back in 2011? Well, the data suggest that this spending reduction is biting.


Chart 2

pastedGraphic_1.pdf


Are Banks Going to Suffer a Deposit Outflow on January 1?


That’s the talk around the wood stove at the general store up here in the Wisconsin tundra. Yes, that special FDIC insurance on non-interest-bearing bank deposits is due to expire in 2013. Without this insurance, pension funds and large corporations are expected to pull their funds out of banks and put them in some other federally-insured instrument, such as a Treasury bill. (Where will the funds go if Congress does not increase the debt limit?). But if this happens, will the banking system actually lose deposits? Not unless the pension funds et.al. decide to hold actual folding money. Suppose that a pension fund decides to buy a new T-bill from the Treasury, paying for it by drawing down an account at its bank. The pension fund’s bank does see its deposits fall, all else the same. But what does the Treasury do with its new funds? It spends them. So, the deposits come back into the banking system. There may be real things to worry about with regard to our financial system, but this isn’t one of them.


Discouraged Dropouts Are Largely Responsible for the Declining Unemployment Rate?


Again, doesn’t anyone look at the relevant data? The BLS has a measure of the unemployment rate that adds back in so-called discouraged workers. It is called the U-5 measure. The first measure of the unemployment rate to hit CNBC’s crawl is the U-3 rate that the talking heads then disparage because of a declining labor force – “thought” to be declining because of discouraged workers. I put thought in quotes because the talking heads never look at U-5, which includes the discouraged to see how it changed. But if they did look at Chart 3, they would see that both the “headline” unemployment rate, U-3, and the more inclusive unemployment rate, 

U-5, both have fallen by one whole percentage point in the 12 months ended November 12. What the talking heads fail to take into consideration is that more and more of us baby boomers are voluntarily dropping out of the labor force. It is called retirement. And so long as Congress doesn’t means test our Social Security and Medicare A benefits, more and more of the luckiest generation will continue to voluntarily drop out of the labor force.


Chart 3

pastedGraphic_2.pdf


Alright, now it’s time for the feats of strength. You can pin Paul (Ron, that is) Bernanke!

Posted in Uncategorized | Comments Off on Fiscal Cliff — Little More than a Speedbump

Instinet Tops As Preferred Broker – FactSet

Instinet, a global leader in electronic trading and agency-only brokerage services, today announced that its Instinet, LLC subsidiary has been named a “Preferred Broker” by FactSet, a leading provider of integrated financial information and analytical applications to the global investment community.

“FactSet is an extremely well-regarded firm, whose data and analytics are integral to the workflow of many investment professionals. We’re very pleased to be named one of their preferred brokers,” said Jonathan Kellner, president of the Americas at Instinet.

“Instinet’s agency-only model, advanced electronic execution suite and award-winning commission management platform have all led to it being a widely-used broker by our client base. I am always impressed by the positive feedback we receive from clients that leverage Instinet for their execution and commission management needs,” added John Wiseman, senior vice president at FactSet.

FactSet is the second firm to designate Instinet a Preferred Broker, joining Zelman & Associates. In addition, six independent research firms rely on Instinet for third-party marketing support through the Instinet Access program.

Posted in Uncategorized | Comments Off on Instinet Tops As Preferred Broker – FactSet

European Markets Hit New Peaks with ECB Press Confab

Exegy, Inc., the market data systems company, announced today that the MarketDataPeaks.eu website hit a new record peak of 321,000 messages per second. The Exegy Ticker Plants in the colocation facilities in Europe that drive the MarketDataPeaks.eu website hit this processing peak at 1:35 BST (British Summer Time) on Thursday, 2 August. This compares to 314,000 messages per second on 13 April when the market was reacting to worsening economic conditions in Spain.

At 1:35 BST the market reacted to the European Central Bank press conference led by ECB president, Mario Draghi. The conference which started at 1:30 UKT, was watched with anticipation as Europe waited to hear an announcement from the ECB about steps to take concrete action to save the euro and countries of the European Union. At 1:34, Draghi said that governments should prepare to activate EFSE and ESM bond buying mechanisms. Simultaneously, major European indices were rising with the anticipation of great news. This excitement resulted in a sudden spike of electronic messages flowing through each European trading venue

Of the six exchanges reported on www.MarketDataPeaks.eu, half of them reached record peaks. The London Stock Exchange hit 37,000 mps, BATS Europe 36,000 mps, and BATS Chi-X Europe touched 81,000 mps.

Several colocation facilities provide all the updates for www.MarketDataPeaks.eu, the first public website that provides a minute-by-minute account of the aggregated volume of market data messages across major European exchanges. The site is sponsored by Exegy, MarketPrizm, and the Financial Information Forum.

Posted in Uncategorized | Comments Off on European Markets Hit New Peaks with ECB Press Confab

Gresham’s CTC reconciles transactions

 London, 1st August 2012, Gresham Computing plc, a leading provider of transaction control solutions to international financial institutions, today announced that its reconciliation solution Clareti Transaction Control (CTC) has achieved unprecedented transaction processing times in a series of benchmarking tests conducted with Intel. These tests included load and match into a database of over 50,000 equity trade transactions per second and were conducted in June 2012 on the Intel® Xeon® Processor E7 family, at Intel’s Computing lab in Reading, United Kingdom.

 “These results show how Gresham’s CTC is delivering a much needed step change in financial institution reconciliations. This is essential as financial institutions seek to get more done faster. With organisations placing greater emphasis on effective internal control environments, inter-systems matching and reconciliation is becoming a vital component in minimising operational risk. The scalability and performance of CTC responds to market needs and is way beyond the capabilities of traditional Nostro reconciliation-based engines,” said Neil Vernon, Development Director, Gresham Computing plc. 

CTC was built using the GigaSpaces XAP elastic application platform as an integral part of its infrastructure. XAP is geared for big data, employing an in-memory data grid for tremendous processing speed, ‘share-nothing’ partitioning for reliability and consistency and event-driven architecture that enables real-time processing of massive event streams and unlimited processing scalability. With CTC, organisations can rapidly replace existing manual and semi-automatic internal controls with automated controls, secure in the knowledge that CTC can easily scale to cope with higher volumes in the case of future growth or consolidation.

In the past institutions might have needed multiple reconciliation systems to handle large volumes of transactions close to real-time. They can now process these through a single instance of CTC, making significant cost and efficiency savings. CTC has the scalability to handle the transaction processing needs of industry consolidators such as OTC central clearing bodies or reconciliation service providers – all of whom have growing demands for volume and need to get things done faster.

Gordon Hughes, Alliances Director Financial Services, Intel, commented, “We are impressed by the results that Gresham’s CTC solution achieved in their rigorous performance testing conducted at Intel’s fasterLAB. Financial services customers are at the forefront of high performance and scalability demands, and in these tests the Intel® Xeon® Processor E7 family has demonstrated CTC’s ability to deliver significant performance and power efficiency in the reconciliation environment. The ability to process 200 million transactions per hour gives customers the certainty they need that as their volumes grow, CTC running on Intel processors can scale to the needs of their enterprise.” 

These benchmark tests with Intel are the beginning of a long partnership between the two companies giving customers performance and scalability certainty.


Posted in Uncategorized | Comments Off on Gresham’s CTC reconciles transactions

HFT Costs Long-Term Investors — Pragma Research

 Pragma Securities, an independent algorithmic trading boutique, today announced recommendations for market structure changes, which would reduce the amount investors lose in trading costs. The recommendations are based on recent Pragma research showing that when High Frequency Trading (HFT) market makers compete with directional traders, i.e., investors, to earn spreads and rebates by providing liquidity, investors are forced to cross the spread more often, which results in higher costs.

Many ultra-high-volume stocks have disproportionally long order queues—a result of the huge number of HFT orders competing to provide liquidity compared with the rate at which aggressive orders arrive to take that liquidity. The effect is most problematic in low-price, low-volatility stocks. In these instances, the excessive competition makes it harder for directional traders to successfully provide liquidity. Instead, they must cross the spread more frequently, increasing their overall trading costs. One solution, according to Pragma’s research, is to reduce the tick size in low-priced stocks to $0.001, resulting in narrower effective spreads, reduced profits drawn out to market makers and providing a net savings for investors.

David Mechner, CEO of Pragma, notes that while market-making is an important function in the smooth operation of markets, the penny tick size—when combined with the current maker/taker system of exchange fees and rebates—distorts the market and effectively forces investors to subsidize the activity of HFTs. “Our research presents strong evidence that market makers’ liquidity does not come for free, and a reduction of tick size and rebates for providing liquidity will provide directional traders with more control over their trading costs,” commented Mechner.

With HFT accounting for upwards of 50 percent of market volume according to some estimates, regulatory focus on the practice has increased considerably, particularly following the so called “flash-crash” of May 2010. However, while prevailing industry sentiment on HFT is negative, the consensus academic view remains that HFT market makers provide a valuable service to the market through the liquidity they provide. However, as Pragma notes in its research paper, there is an inherent paradox in HFTs simultaneously creating better trading opportunities for directional traders while pulling $5 billion annually out of the market in trading profits, according to estimates from the TABB Group.

Pragma’s observations, built on the latest in its ongoing series of research notes, sheds light on the impact HFT market makers have on trading costs as a result of the current regulatory environment, and, further, provides concrete recommendations that would allow counterparties to interact at a more natural equilibrium.

 “Our clients depend on us to provide novel insights into trading and what drives trading performance, including aspects of market structure.” explained Eran Fishler, COO and Director of Research at Pragma. “Technology is constantly changing how investors interact with the market, and as an independent provider of trading tools, our clients look to us for unbiased, empirically grounded information.”

To access Pragma’s research, please visit www.pragmatrading.com.  

Posted in Uncategorized | Comments Off on HFT Costs Long-Term Investors — Pragma Research